COO scRNAseq
Single cell RNA sequencing (scRNAseq) data analysis, BMW20421 2024-2025 Bio-informatica practical, BMW, Utrecht University
Onur BASAK, PhD
12/3/2025
Preparation
Install packages
You need to do this only once!
The script below checks whether the listed packages are installed on
your computer. If they are not, install.packages() function
will automatically install the missing packages.
Note that you may need to update your R!
## First specify the packages of interest
packages = c("devtools","hdf5r","dplyr","ggplot2","stringr",
             "RColorBrewer","useful","readr","BiocManager")

## Now load or install&load all
# Start with Matrix, which has compatibility issues on some computers
install.packages("Matrix")

# Then the rest. This function first checks if the package listed in variable "packages" is installed. If not, it will install them
package.check <- lapply(
  packages,
  FUN = function(x) {
    if (!require(x, character.only = TRUE)) {
      install.packages(x, dependencies = TRUE)
      library(x, character.only = TRUE)
    }
  }
)
Seurat for scRNAseq data analysis
The following is necessary for interaction with hdf5 objects, and can only be installed using BiocManager installer.
1. Introduction
In this COO, you will learn how to analyse single cell RNA sequencing data (scRNAseq) using the well established Seurat pipeline.
This pipeline includes functions that do most of the work ‘behind the scenes’. This makes the tool very user friendly. There is extensive documentation on the use of the pipeline. The following tutorial is the closest to what we will do today: https://satijalab.org/seurat/articles/pbmc3k_tutorial.html
Set working directory
In RStudio, the working directory is set to your home directory after
the chunk is run!
Thus, you may need to run this on the console (a
seperate window at the the bottom-left of Rstudio). An alternative is to
use the pull down menu (Files) at the top of the bottom-right window of
RStudio. Click Files/More to see the option
# Don't forget to chage the path you a path on YOUR computer
setwd("/Users/onurbasak/Library/CloudStorage/OneDrive-UMCUtrecht/1_BCRM/11 teaching/Bachelor/Bioinformatics_BMW/2024/COO/")
Tip: When the cursor is next to the first
", you can press TAB button on your keyboard.
This will show the files that are in your home directory. It is possible
that the data is stored at a different locations than your home
directory. Then, provide a full path
Load libraries
# load all necessary libraries, which contain the function necessary for the scRNAseq pipeline, into the memory
library(Seurat,verbose = FALSE)
library(dplyr,verbose = FALSE)
library(ggplot2,verbose = FALSE)
library(stringr,verbose = FALSE)
library(RColorBrewer,verbose = FALSE)
library(useful,verbose = FALSE)
library(readr,verbose = FALSE)
library(hdf5r,verbose = FALSE)
2. Seurat analysis
For today’s tutorial, we will use the scRNAseq atlas of the adolescent mouse cortex published by Saunders et al 2018. This data is extensive and is available at https://www.mousebrain.org. There is an online tool with which you can browse the data. You can do this, for instance, to get inspiration for your practice questions.
Aim
Process the scRNAseq data of the adolescent mouse cortex and identify cell types
\(~\)
Why? A major use of the scRNAseq is cell type identification. To achieve this,
1. you first need to perform quality control steps (pre-processing).
2. Then, you need to ‘classify cells’ into similar groups. We call this process “clustering”.
3. To visualize the data, you will perform dimensionality reduction which summarises the information in a few dimensions.
4. Finally, you can plot marker genes that you find from the literature to reveal the cell type identity of clusters
\(~\)
It is time for the scRNAseq analysis!
The data is saved as a Seurat object. This object made specially
for the Seurat pipeline has a lot of ‘slots’ where information
can be stored.
2.1 The dataset
The data was downloaded and processed into a ‘Seurat object’ to
prevent technical errors, and saved as
Linnerson_cortex_10X22.rds.
You can download them right here (right click > ‘Save link as…’):
2.1.1 Load the dataset
# This works only if the file is under the folder "data" in your working directory. If not, adjust it accordingly
dataset <- readRDS(file = 'data/Linnerson_cortex_10X22.rds')
dataset
Note: The object contains data from 6658 cells (samples) and 27998 features (genes). There is 1 assay (RNA).
2.1.2 Check the metadata
This is where ‘cell level’ information is stored. For instance, the sex of the animal, total number of reads (RNA molecules) detected in a cell, any information provided by the authors etc are stored here. You will need to use this for Practice 5.
| orig.ident | nCount_RNA | nFeature_RNA | Age | AnalysisPool | AnalysisProject | |
|---|---|---|---|---|---|---|
| cortex1_10X22_2_ACAATAACTGTAGC-1 | 10X22 | 5030 | 1942 | p23 | Cortex1 | Adolescent |
| cortex1_10X22_1_AGGTTCGAAACGTC-1 | 10X22 | 2122 | 1010 | p23 | Cortex1 | Adolescent |
| cortex1_10X22_1_TGACTTTGGCATAC-1 | 10X22 | 2677 | 1219 | p23 | Cortex1 | Adolescent |
| cortex1_10X22_2_GTGAGGGACGTAAC-1 | 10X22 | 2648 | 1232 | p23 | Cortex1 | Adolescent |
| cortex1_10X22_2_CACCGTTGGACGTT-1 | 10X22 | 4586 | 1939 | p23 | Cortex1 | Adolescent |
| cortex1_10X22_2_GAGCGAGAACGTAC-1 | 10X22 | 5807 | 2292 | p23 | Cortex1 | Adolescent |
2.2 Quality metrics
2.2.1 Plot some quality metrics
An important metric is the number of RNA molecules (nCount_RNA) and genes (nFeature_RNA) per cell. These are automatically calculated when the Seurat object is generated form a data matrix.
# The thickness of a Violin plot shows where most data points are
VlnPlot(object = dataset, features = c("nCount_RNA", "nFeature_RNA"), cols = "blue",
                pt.size = .01)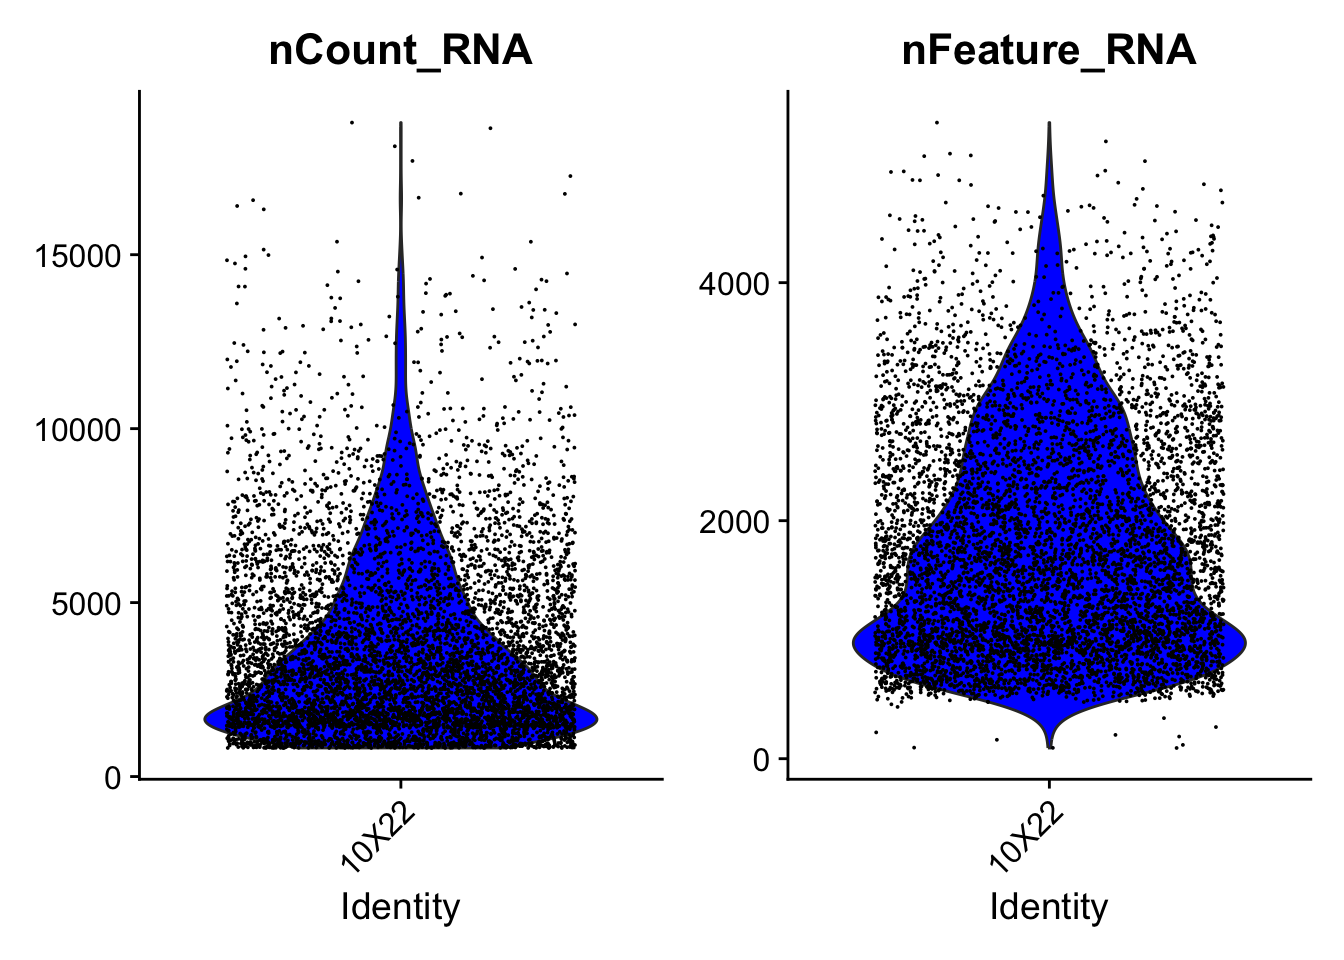
2.2.2 Calculate additional QC metrics (PLEASE READ CAREFULLY!!)
Start by generating QC metrics additional to the no of genes/features.
Mitochondrial RNA is the mRNA that is generated by the mitochondrial genome. Normally, these constitute a small fraction of the total mRNA. However, in dying or damaged cells, while cytoplasmic/nuclear mRNA degrades rapidly, mitochondrial mRNA is rather well preserved. Thus, a high ratio of (>10-30%) mitochondrial mRNA indicates BAD cell quality. These should be excluded. The cut-off depends on the technical details and personal choice.
!! We will not go through the following: mRNA coding for the Ribosomal subunit proteins is abundant (not to be confused with rRNA, which does not code for protein but is a part of the ribosome complex). Usually, a high ribosomal RNA percentage indicates production of a lot of proteins, and is very high in dividing cells or some secretory cells that need to constantly produce proteins. However, if most of the mRNA (>30-50%) that we detect is ribosomal, it means that the valuable information in this cell would be very limited and that we should exclude it from the analysis.
2.2.3 Plot the additional quality metrics
We can use the VlnPlot() function of the Seurat package to visualize QC metrics.
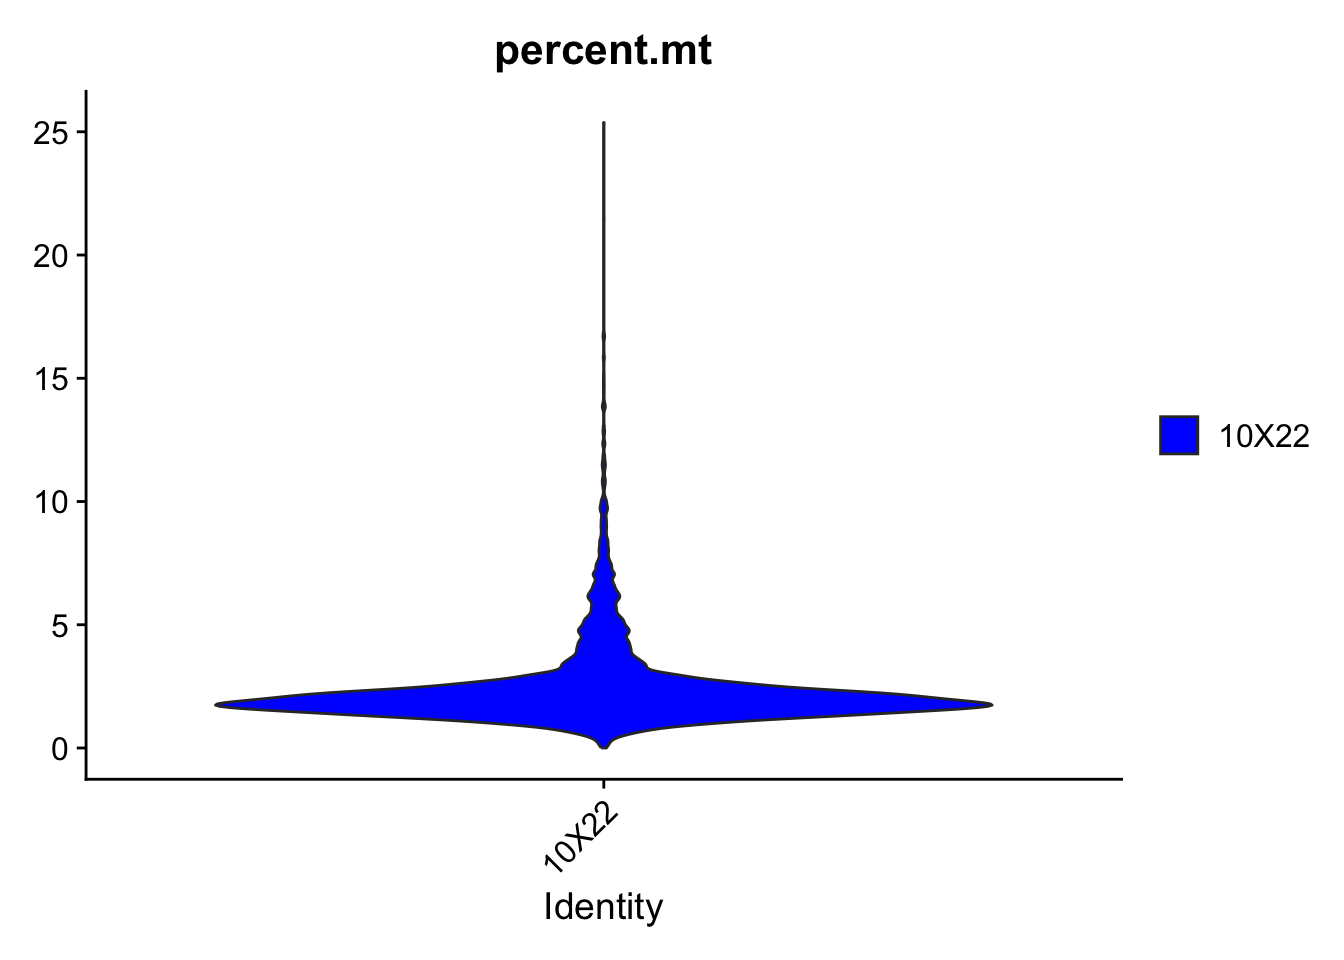
Visualize how mito and ribo percentages change as a function of the number of counts.
# You can use any column from the metadata to plot onthe x or y axis
plot1 <- FeatureScatter(dataset, feature1 = "nCount_RNA", feature2 = "percent.mt",pt.size = 2, cols = "blue")
plot2 <- FeatureScatter(dataset, feature1 = "nCount_RNA", feature2 = "nFeature_RNA",pt.size = 2, cols = "purple")
plot_null <- ggplot() + theme_void()
(plot1 + plot2)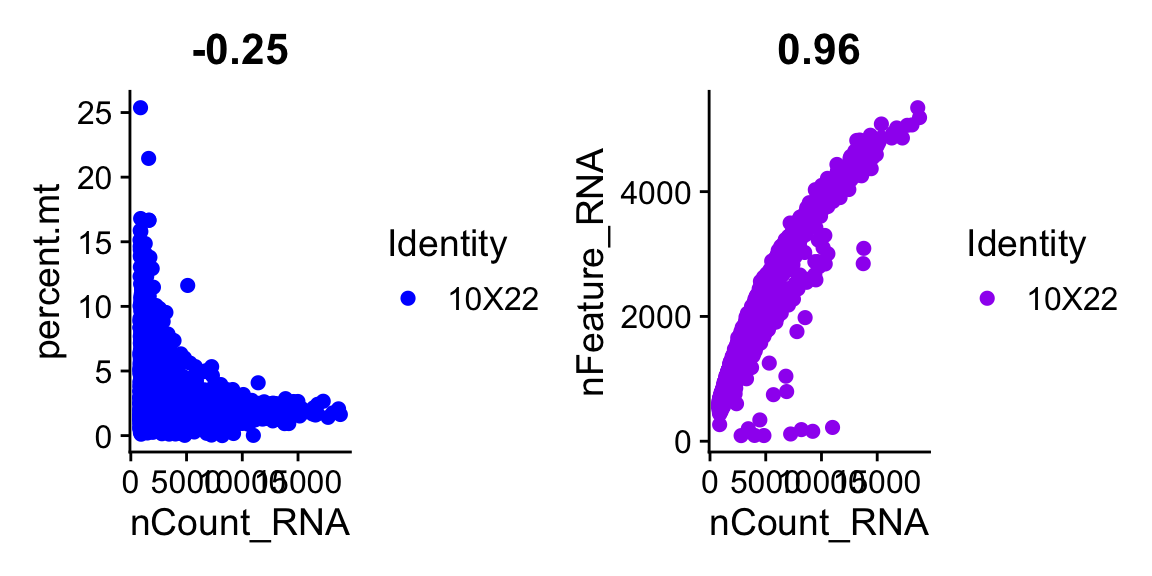
Question 1
What is the relationship between total number of RNA per cell
(nCounts) and
i) mitochondrial RNA percentage?
ii) ribosomal RNA percentage?
ii) number of features? \(~\)
Practice 1
We do not want to have low quality cells in our data. Looking at the plot, determine which cells to get rid of.
TIP: See the explanation of QC metrics above! \(~\)
\(~\)
Use subset() to fetch the cells that fit in your description. This
fill get rid of any cells that are above your threshold. Check
dataset to see how many cells are left. If this is too
little, you may want to relax your threshold.
cutoff_mito = ##ENTER A VALUE HERE##
dataset <- subset(x = dataset, subset = percent.mt < cutoff_mito)
2.4 Normalise
In Seurat, standard pre-processing workflow is replaced by a single command. However, it is good to see this part to learn each step.
First, we will normalize the data. This is to get rid of the differences in total RNA counts between cells. In other words, we will equalize the total count number in each cell to a fixed number (e.g. 10000 RNA molecules per cell).
Why do we need this? You may have huge differences
in total RNA between cells (e.g. 1000 versus 12500), which will cause
technical differences that you do not want to include in your dataset.
Log normalization (method = "LogNormalize") means that we
first log transform the data, then make sure that the total number of
reads in each cells is approxamely the same (as
scale.factor, which is 10000 by default).
2.5 Detection of variable genes across the single cells
We want to find out ‘informative genes’ that will explain biological differences to use in some of the downstream applications. If a gene is expressed everywhere, that doesn’t tell us much. However, if a gene is expressed in only a subset of cells, this will cause ‘variation’..
We can detect these genes using FindVariableFeatures()
function.
## Here, we select the top 1,000 highly variable genes (Hvg) for downstream analysis.
dataset <- FindVariableFeatures(object = dataset, selection.method = 'mean.var.plot', mean.cutoff = c(0.0125, 3), dispersion.cutoff = c(0.5, Inf))
length(x = VariableFeatures(object = dataset)) #3084
## [1] 8472Visualize top 10 most variable genes.
# Identify the 10 most highly variable genes.
top10 <- head(VariableFeatures(dataset), 10)

## Plot
# plot variable features with and without labels
plot1 <- VariableFeaturePlot(dataset)
plot2 <- LabelPoints(plot = plot1, points = top10, repel = TRUE)
## When using repel, set xnudge and ynudge to 0 for optimal results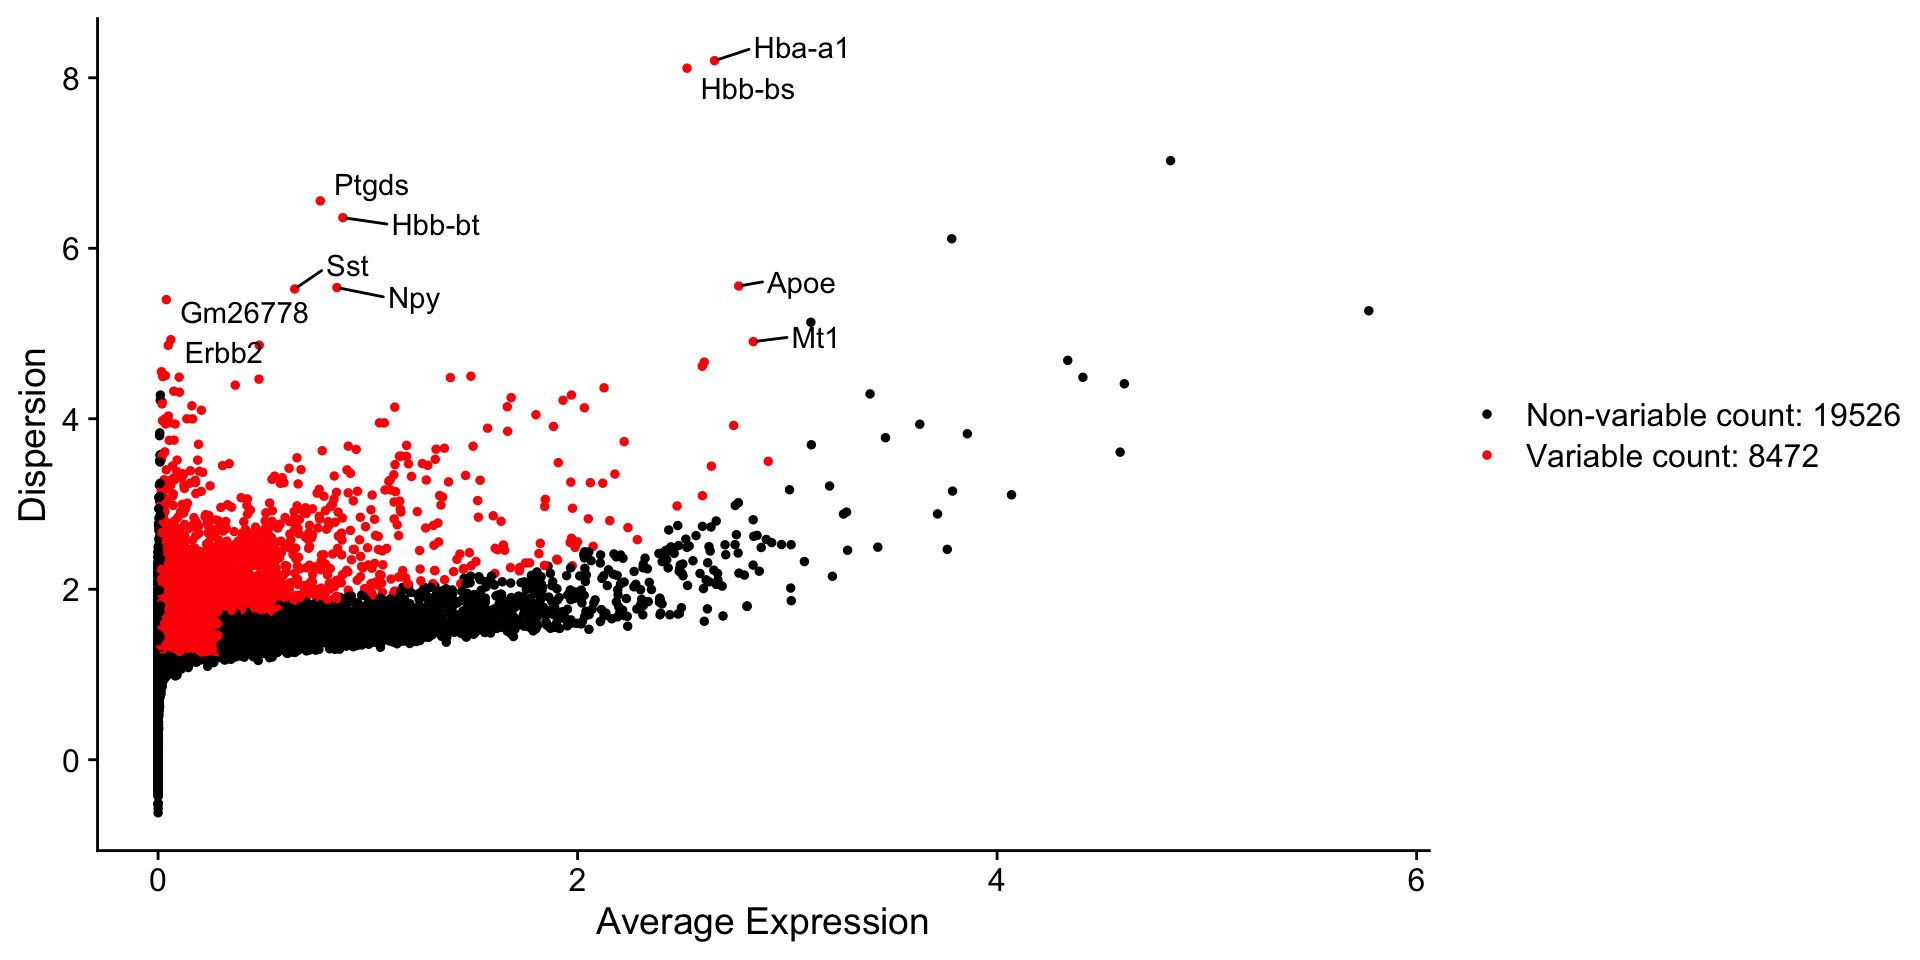
Note:Dispersion indicates variation, while red color shows ‘significantly variable’ genes
Print the top 1000 highly variable genes.
hv.genes <- head(rownames(HVFInfo(object = dataset)), 1000)
head(hv.genes,n=100) # list the first 100
## [1] "Cd79b" "Tbxas1" "Tifab" "Itpripl2" "Notum" "Acvrl1" "Rad54b" "Mill2" "Hcn2" "Tnfaip6"
## [11] "Cldn11" "Ermn" "Gjb1" "Car14" "Lpar1" "Gsn" "Trf" "Serpinb1a" "Itgb4" "Opalin"
## [21] "Gpr37" "Aspa" "Mag" "Mog" "Tmem88b" "Plekhh1" "Dock10" "Tspan2" "Prr5l" "Gjc3"
## [31] "Hapln2" "Ppp1r14a" "Mal" "Ugt8a" "Fa2h" "Arsg" "Phldb1" "Gpr17" "Sema5a" "Kif19a"
## [41] "Cd9" "Bcas1" "Tmem163" "Tcf7l2" "Enpp6" "Rassf10" "Col9a3" "Pak4" "Rnd2" "Myrf"
## [51] "Bfsp2" "Il23a" "Ndrg1" "Fgfr2" "Ttyh2" "Anln" "Trim59" "Plekhg3" "Padi2" "Pacs2"
## [61] "Cdh19" "Ms4a7" "F13a1" "Lyz2" "Pf4" "Clec4n" "Ccl24" "Clec4a2" "Ccl12" "Cyba"
## [71] "Cbr2" "Cd209f" "Mrc1" "Fcer1g" "Cd14" "Cd37" "Hpgds" "Arl11" "Stac" "Hk3"
## [81] "Spi1" "Fcrls" "Slc2a5" "Lcp2" "Slc39a12" "Trem2" "Hmha1" "Tgfbr1" "Ext1" "Pld4"
## [91] "AI662270" "Dock2" "Abi3" "Lrrc25" "Cd53" "Cyth4" "Siglech" "Adap2os" "Fcgr1" "Fcgr2b"2.6 Scale the data and get rid of the confounders
Scaling (standardization) is the process in which we convert the expression values of a gene into “standard deviation from the mean”. For instance, if a gene is expressed at the same level in a cell as its average in the dataset, it will have a value of 0. If it is “1 standard deviation” higher, then it will be +1.
We will only take the highly variable genes (hv.genes)
to scale and use in downstream dimensionality reduction.
We can also get rid of the confounding factors at this point. These factors introduce ‘technical noise’ to the data. For instance, the number of reads per cell can influence the amount of information in a cell and make it seem different from another cell with low RNA levels, even though they are similar cells.
We will use the ScaleData() function of the Seurat
package. The confounding factors can be discarded using
vars.to.regress.
Mitochondrial gene percentage and number of features (genes) are the highest confounding factors and will be regressed out.
dataset <- ScaleData(object = dataset, features = hv.genes, vars.to.regress = c("percent.mt","nFeature_RNA"))## Regressing out percent.mt, nFeature_RNA## Centering and scaling data matrixDimensionality reduction
2.7 PCA analysis
2.7.1 Perform PCA
Performing Dimensionality reduction in Seurat is very simple!
# Calculate the principle components
dataset <- RunPCA(object = dataset, features = hv.genes, verbose = FALSE,npcs = 50)
Done! We have calculated 50 principle components, which summarize the variation in the dataset in an organised manner. Principle component 1 explains the highest variation. These are ‘coordinates’; cells with similar values do not differ on this component, while cells with different values (e.g. -5 and 20) are rather different. Note that the values do not really mean something; they are all relative values. Also, the direction (+, - ) of te values doesn’t mean anything. Of course, cells on different end of the coordinate (e.g. -20, +30) are very different from each other on this coordinate.
2.7.2 Plot PCA results
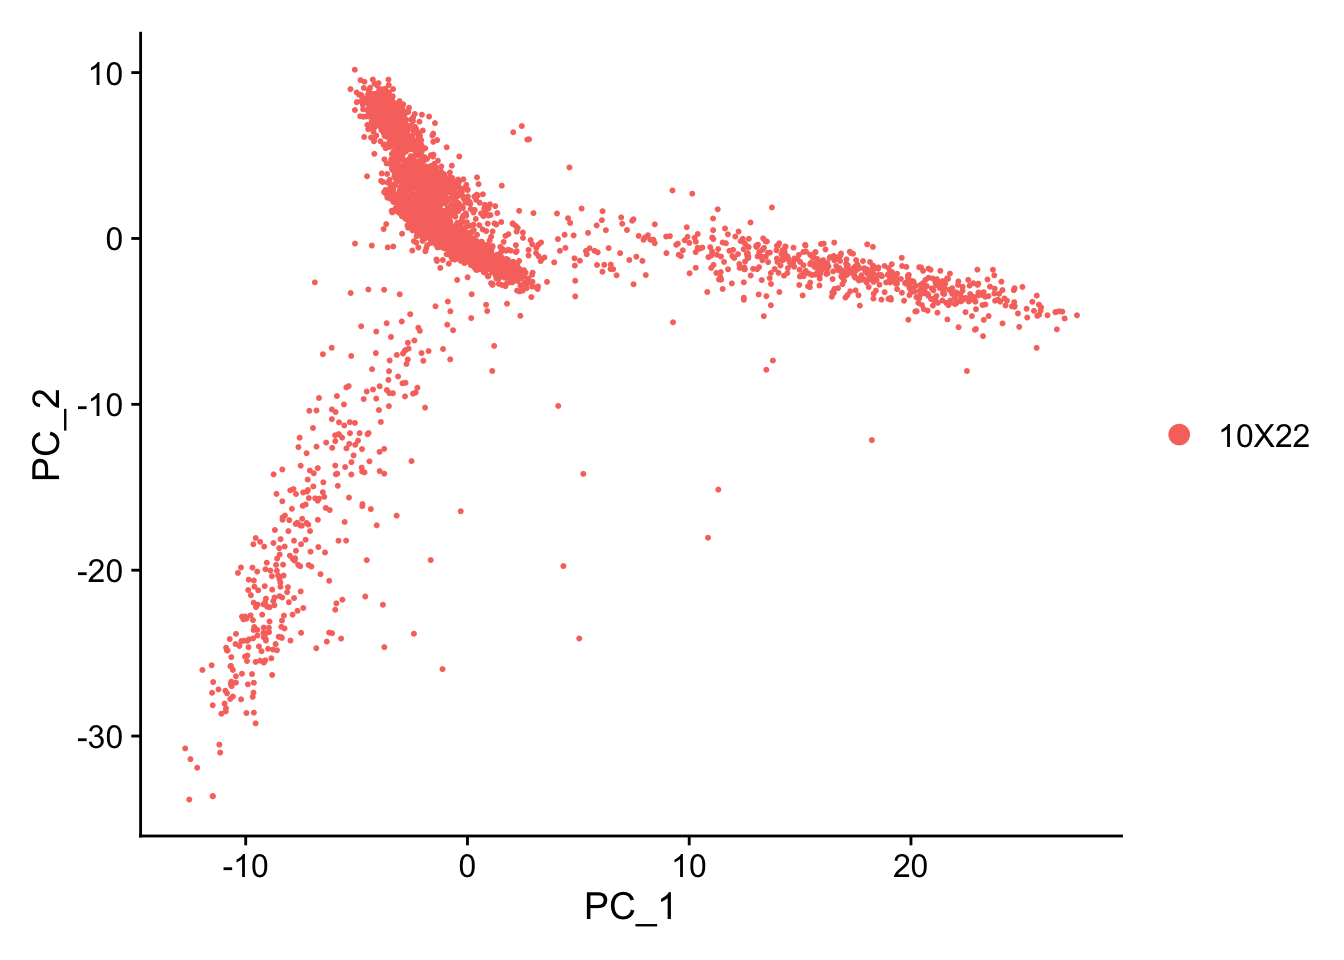
Does your PC different than what you see on this html file? This is likely because we used different cut-offs or settings. It is totally normal to have different plots (e.g. inverted).
Heatmaps We can use an integrated function of Seurat to plot heatmaps to visualize genes that drive different principle components. Here, each row is one of the top genes that cause variation on this component. Each column is a cell. Yellow color means the component has a high value, while purple means there is low value.
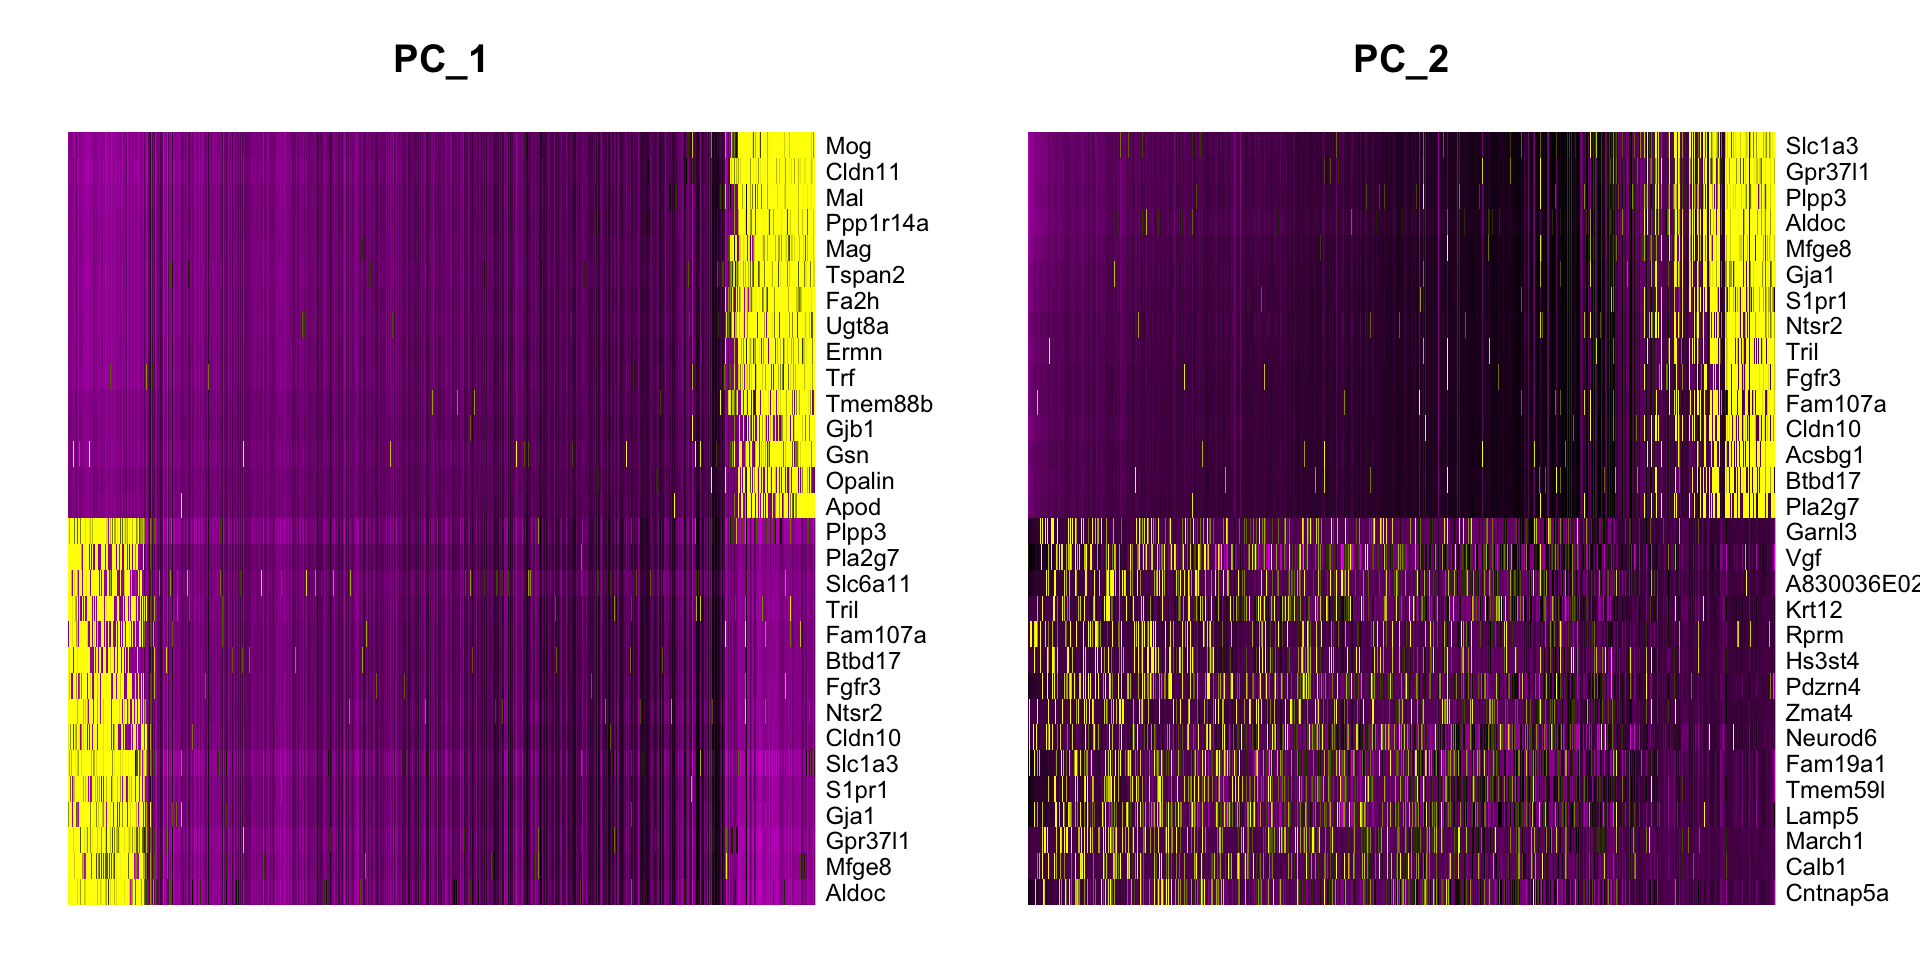
Question 2
What do the genes in principle components tell
us?
\(~\)
2.7.3 Featureplots
Plot some of these genes on PCA plots using the FeaturePlot()
function To see how both the expression level of a gene and how
cells expressing this gene are distributed distributed along different
PCs, we can use the FeaturePlot() function.
Selecting genes
PC1: For me, Aldoc and Mog genes are particularly intriguing. This is because of the biological knowledge that Aldoc is very high in astrocytes and Mog is very high in oligodendrocytes. Their presence on this heatmap suggest that this axis may explain (at least part of) the differences between astrocytes and oligodendrocytes (or between these and the rest).
PC2: Calb1 (a neuronal gene) and Slc1a3 (an astrocyte gene) look interesting.
We can check this by plotting them using the FeaturePlot
function:
plot_f1 <- FeaturePlot(dataset,features = c('Aplp1','Cldn5'),reduction = 'pca',dims = c(1,2),cols = c('gray','blue','red'))
plot_f2 <- FeaturePlot(dataset,features = c('Aldoc','Atp2b2'),reduction = 'pca',dims = c(1,2),cols = c('gray','blue','red'))
plot_f1 / plot_f2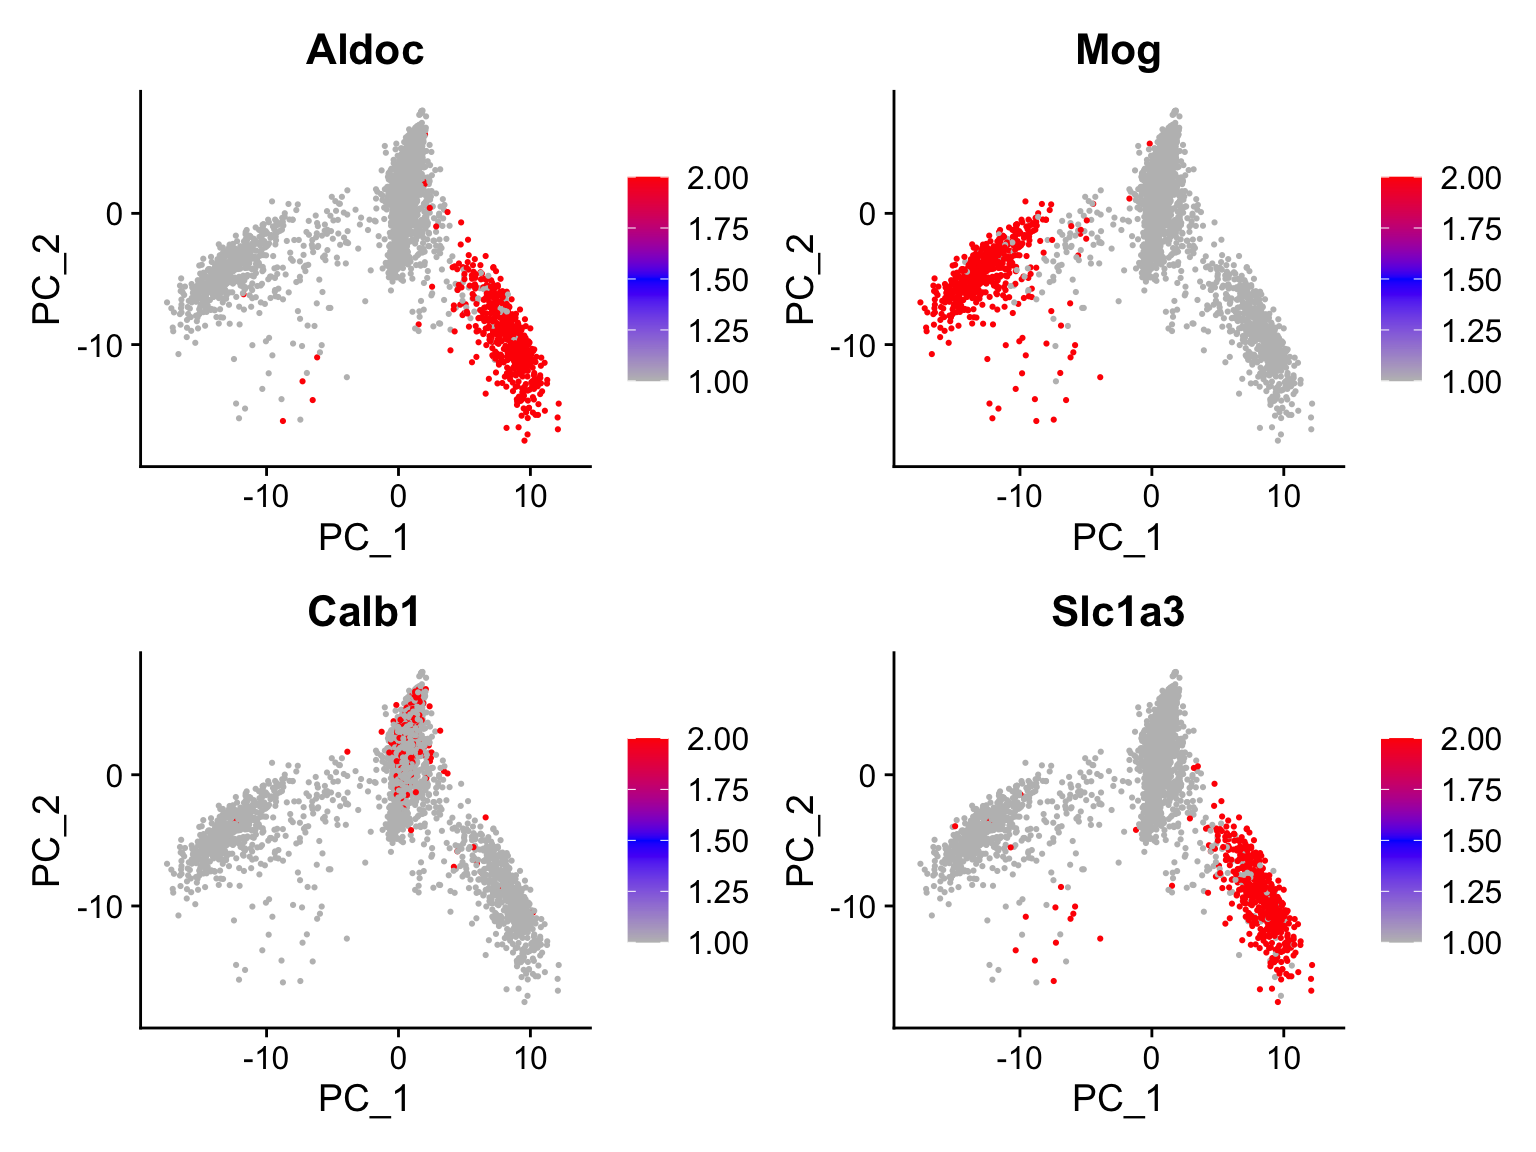
Practice 2
Plot principle components 1, 5, 10, 20, 30 and 40 using
PCHeatmap function.
- What differences do you see?
- Would you include all principle components for downsteram analysis?
Why/why not? \(~\)
\(~\)
2.8 Cluster analysis
We will use a graph-based clustering algorithm discussed at the lecture.
##  We need to build a neighborhood graph.
# One could say that cells closest to each other reside in a neighborhood.
dataset <- FindNeighbors(object = dataset, dims = 1:20)
## Computing nearest neighbor graph## Warning: package 'future' was built under R version 4.5.2## Computing SNNFind clusters using the louvain algorithm
dataset <- FindClusters(object = dataset, resolution = 0.6) # changing the resolution will change the size/number of clusters! c(0.6, 0.8, 1)## Modularity Optimizer version 1.3.0 by Ludo Waltman and Nees Jan van Eck
##
## Number of nodes: 6538
## Number of edges: 241987
##
## Running Louvain algorithm...
## Maximum modularity in 10 random starts: 0.9175
## Number of communities: 19
## Elapsed time: 0 seconds2.9 UMAP
We will use the top PCs to calculate the umap coordinates. You can change the number of PCs based on your observation in Practice 2. When we plot umap, the fault is to plot the results of clustering.
# calculate UMAP coordinates
dataset <- RunUMAP(object = dataset, reduction = "pca", dims = 1:20, verbose = FALSE)
## Warning: The default method for RunUMAP has changed from calling Python UMAP via reticulate to the R-native UWOT using the cosine metric
## To use Python UMAP via reticulate, set umap.method to 'umap-learn' and metric to 'correlation'
## This message will be shown once per session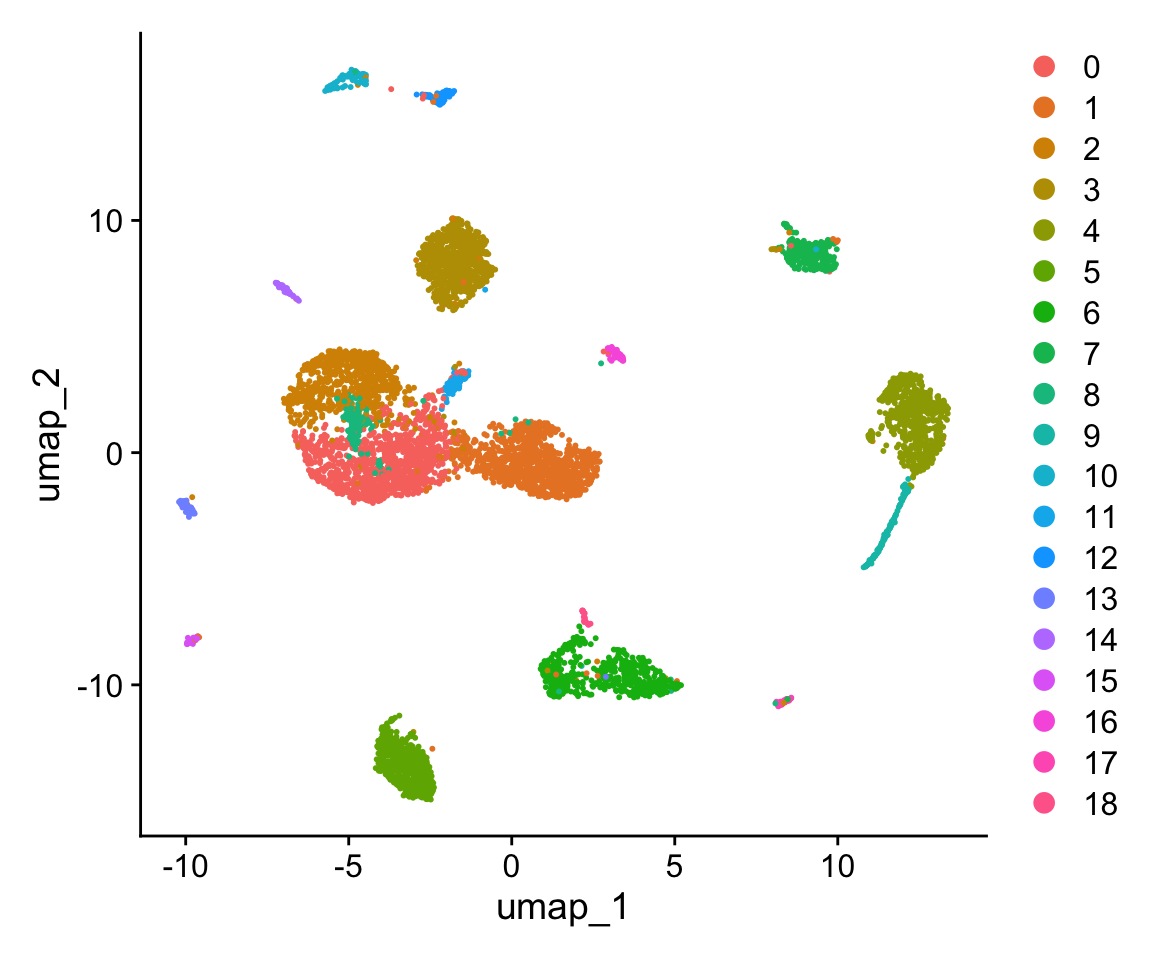
Question 3
Compare pca and umap… Why is there a difference? \(~\)
3. Self Practice
Unlike the previous questions and practices, you will need to do some
work here.
This includes some coding as well as online search for information.
Practice 3
Practice 4
Identify cell types!
Check the top hvgenes that we plotted above. Some of these
are well known markers for cell types \(~\)
Alternatively, use google or pubmed to find marker genes for
neurons, inhibitory neurons, astrocytes and oligodendrocytes. Starting
tip: Rbfox3 (NeuN protein) marks neurons. \(~\)
Plot the expression of these marker genes using the VlnPLot() or FeaturePLot() function \(~\)
END OF THE PRACTICAL!
If you have time, please have a look at the following part
4. Example questions
The following is a question from teh last year. We didn’t go into details of k-Means this year, thus the question may look out of context. But it will give you an idea of what can be expected. A indicated the answer
Question 1
Please list four important facts about the k-means algorithm on the following topics:
- What is it used for?
A: For classification of data into groups/clusters
- Please explain the important steps
A: Determine the expected number of clusters. Take random points in the data and calculate the distance of each point to these random points to assign clusters. Then calculate the center of the cluster. Finally, repeat this process until there is no change in the centeral point, meaning that a stability is reached.
- Name one of the drawbacks
A: needs estimation of the number of clusters beforehand. Cannot work on all different ‘shapes’ of data. Cannot find outliers. Does not show how similar each cluster is.
- If you run the k-means algorithm on the same data two different
times, do you always get the same results? Why/why not?
A: No. The process is stochastic, starts randomly and is repeated many times until stability is reached. The final results will, in most cases, be different.
Here is another question for you to think about:
Question 2
Which steps of the single cell RNA sequencing analysis aims at getting rid of the differences in number of reads between cells (e.g. a cell with 1000 features and another with 5000 features)?
- Scaling
- Normalization
- Regression
- Dimensionality reduction
- Clustering
A: I wont provide the answer for this one
5. Acknowledgements
The images for info boxes are taken from https://www.cleanpng.com
Also see: https://umap-learn.readthedocs.io/en/latest/how_umap_works.html
https://www.oreilly.com/content/an-illustrated-introduction-to-the-t-sne-algorithm