Genomics II - IGV
T Huisman*
2026-03-06
Introduction
We often use tools to inspect our sequence alignment maps. This helps us get a clearer picture of our data. In these exercises, we will use the integrative genome viewer (IGV).
Data Set
We will be using publicly available Illumina sequence data from the
HCC1143 cell line. The HCC1143 cell line was generated from a 52 year
old caucasian woman with breast cancer. Additional information on this
cell line can be found here: HCC1143:
(tumor, TNM stage IIA, grade 3, primary ductal carcinoma) and HCC1143/BL
(matched normal EBV transformed lymphoblast cell line). Reads were
mapped against reference genome Human (GRCh37/hg19).
Reads within these cell lines have been filtered to
chr21:19,000,000-20,000,000 in order to reduce file
sizes.
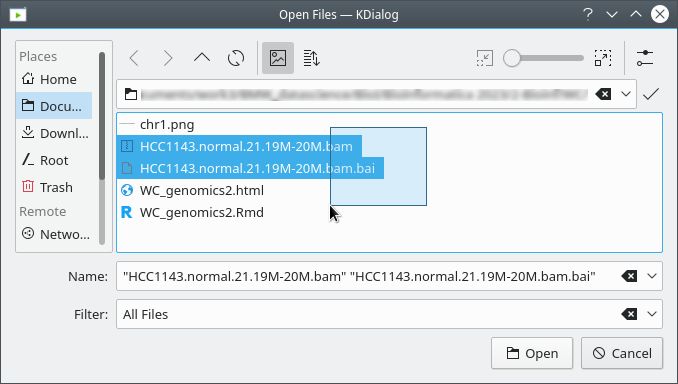
You will need these two files
Integrative Genomics Viewer (IGV)
The Integrative Genomics Viewer (IGV) is a high-performance, easy-to-use, interactive tool for the visual exploration of genomic data. It supports flexible integration of all the common types of genomic data and metadata, investigator-generated or publicly available, loaded from local or cloud sources. https://software.broadinstitute.org/software/igv/
You can install IGV or run it inside your web browser with the IGV-Web application.
The written instructions assume you are using the IGV-Web version.
Getting familiar with IGV
Load a Genome
It is important to use the reference against which you aligned your sequencing data if you wish to properly interpret the alignments! For these exercises, we will be using Human (GRCh37/hg19). You can pick the genome by clicking the drop down menu in the upper-left!
Navigation
You should see a listing of chromosomes for this reference genome Human (GRCh37/hg19). Choose 1, for chromosome 1.
At the top of the track is a schematic representation of of the chromosome with bands in different shades of gray and centromere indicated by red triangles.
Navigate to chr1:10,000-11,000 by entering this into the
location field (in the top-left corner of the interface) and hitting
Enter or clicking on the loop icon. This shows a window of
chromosome 1 that is 1,000 base pairs wide and beginning at position
10,000.

1. Zoom in on the region starting at
chr1:10,000 and make sure you can read the
individual characters of the reference sequence. Which short sequence is
repeated many times in this region?
The Refseq Genes track should also be loaded automatically. It shows genes as blue lines, with bold sections indicating exons.
You can navigate to a gene of interest by typing it into the location field. Try it for your favorite gene, or BRCA1 if you can not decide.
2. See if you can find your favorite gene or BRCA1 and note how it is displayed in the Refseq Genes track.
Loading Read Alignments
We will be using the breast cancer cell line HCC1143 to visualize alignments. For speed, only a small portion of chr21 will be loaded (19M:20M).
Copy the files (see Data Set section at top of this document) to your
local drive, and in IGV choose Tracks >
Local File ..., select the bam file AND the bam.bai file at
the same time, and click OK. Note that the bam and index files must be
in the same directory for IGV to load these properly.
Visualizing read alignments
Navigate to a narrow window on chromosome 21:
chr21:19,480,041-19,480,386.
You will see reads represented by grey or white bars stacked on top of each other, where they were aligned to the reference genome. The reads are pointed to indicate their orientation (i.e. the strand on which they are mapped). Click on any read and notice that a lot of information is available.
3. Click on a random read and see if you can explain what information is reported. You may want to check the SAM file format documentation to look up certain abbreviations and terms: Map Format Specification and Optional Fields Specification.
SNPs
Enter chr21:19,479,321 directly into the location
field
- Notice the
C/TSNP - Right click on the
HCC1143.normal.21.19M-20M.bamtrack at the exact SNP positionchr21:19,479,321and clickSort by...base.
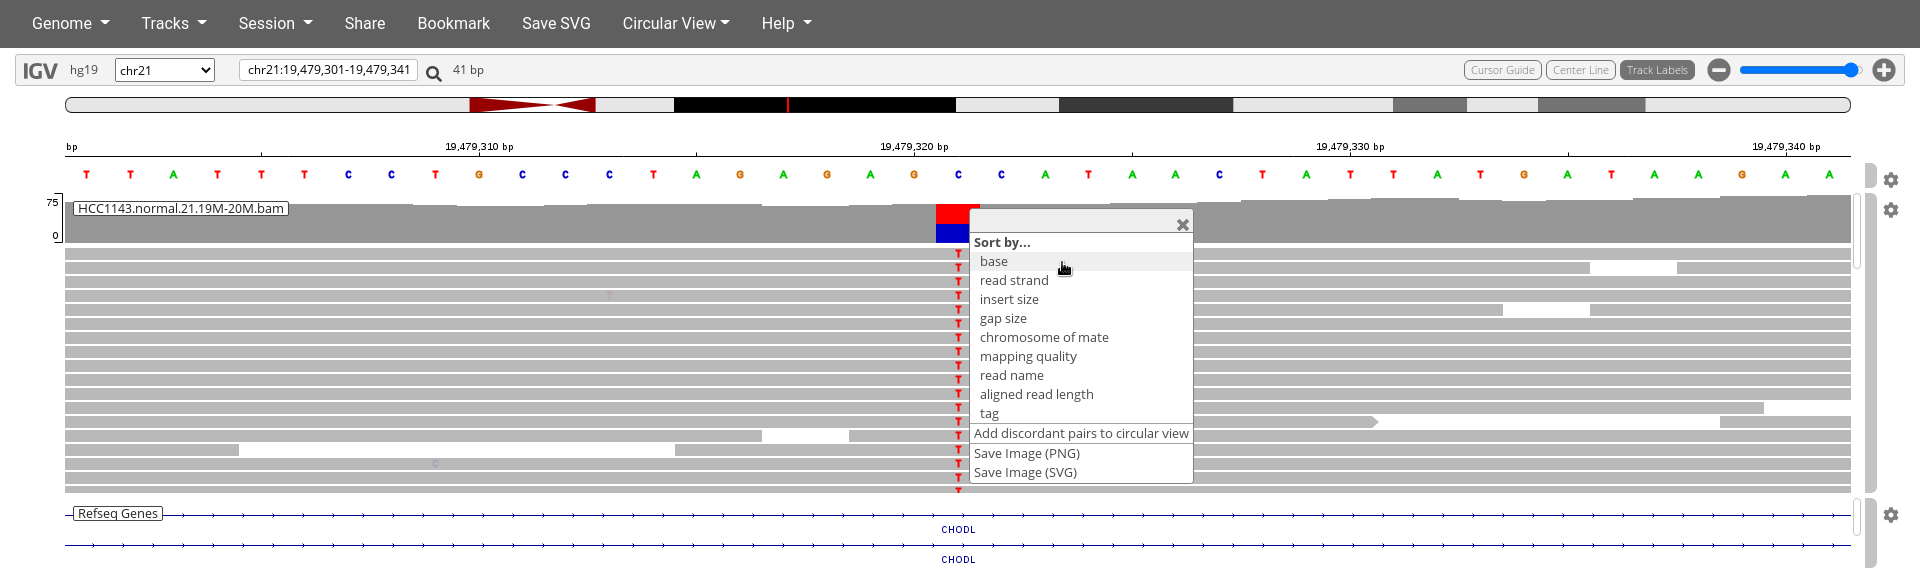
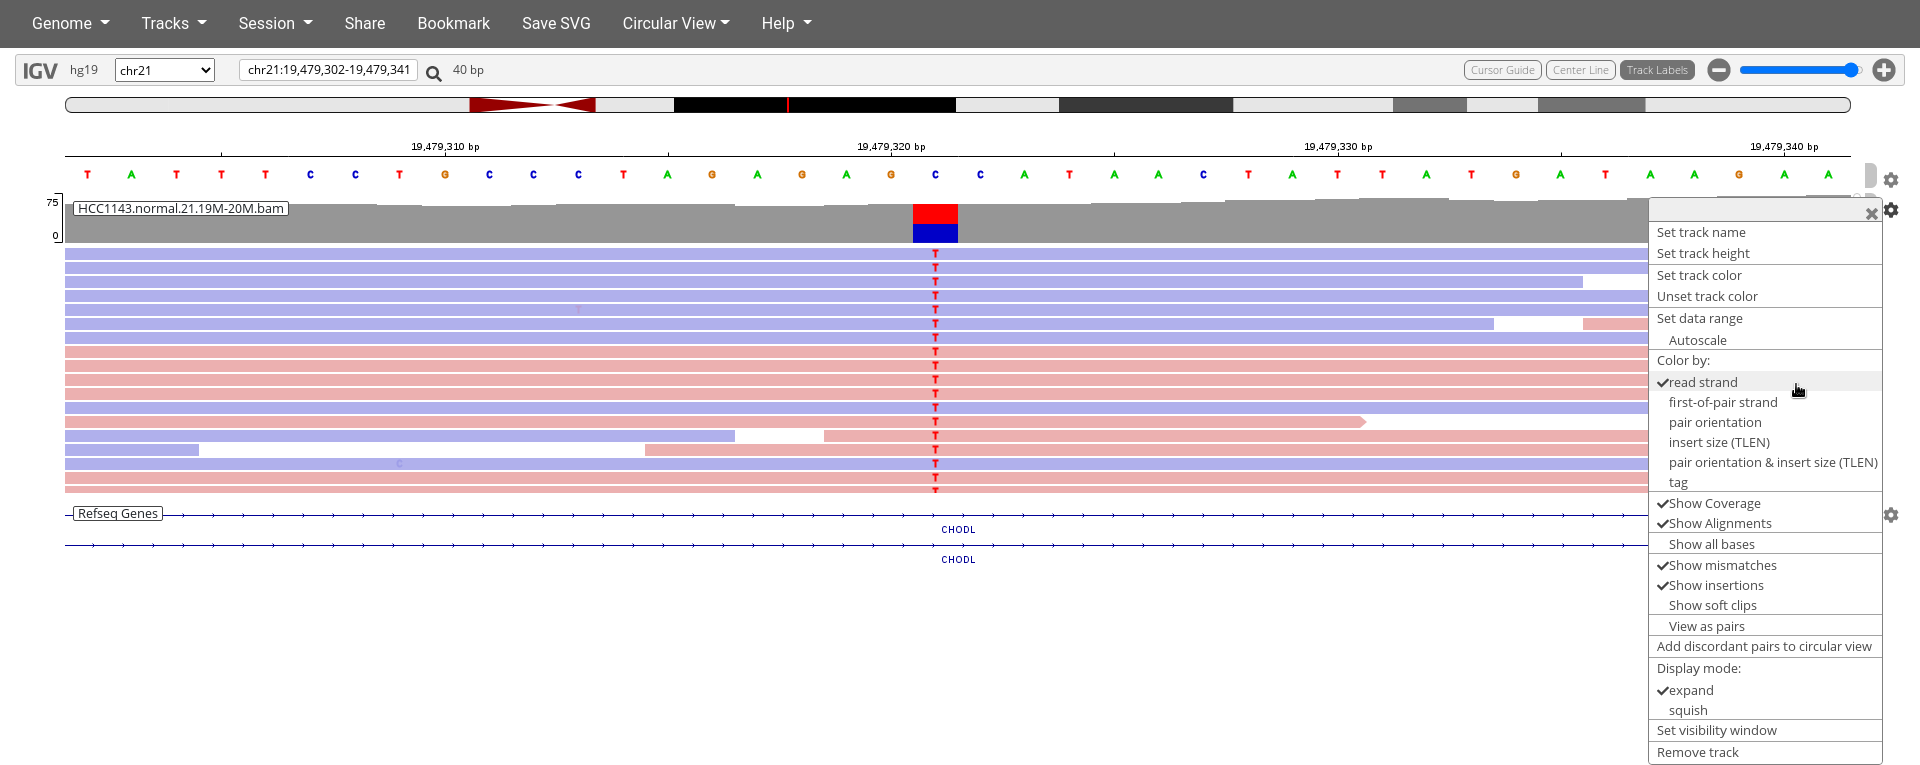
- Click on the cogwheel on the right of
HCC1143.normal.21.19M-20M.bamtrack and clickColor by:read strand
- You can also left click on the top of the
HCC1143.normal.21.19M-20M.bamtrack at the exact SNP positionchr21:19,479,321for a summary of the bases mapped to this exact position.
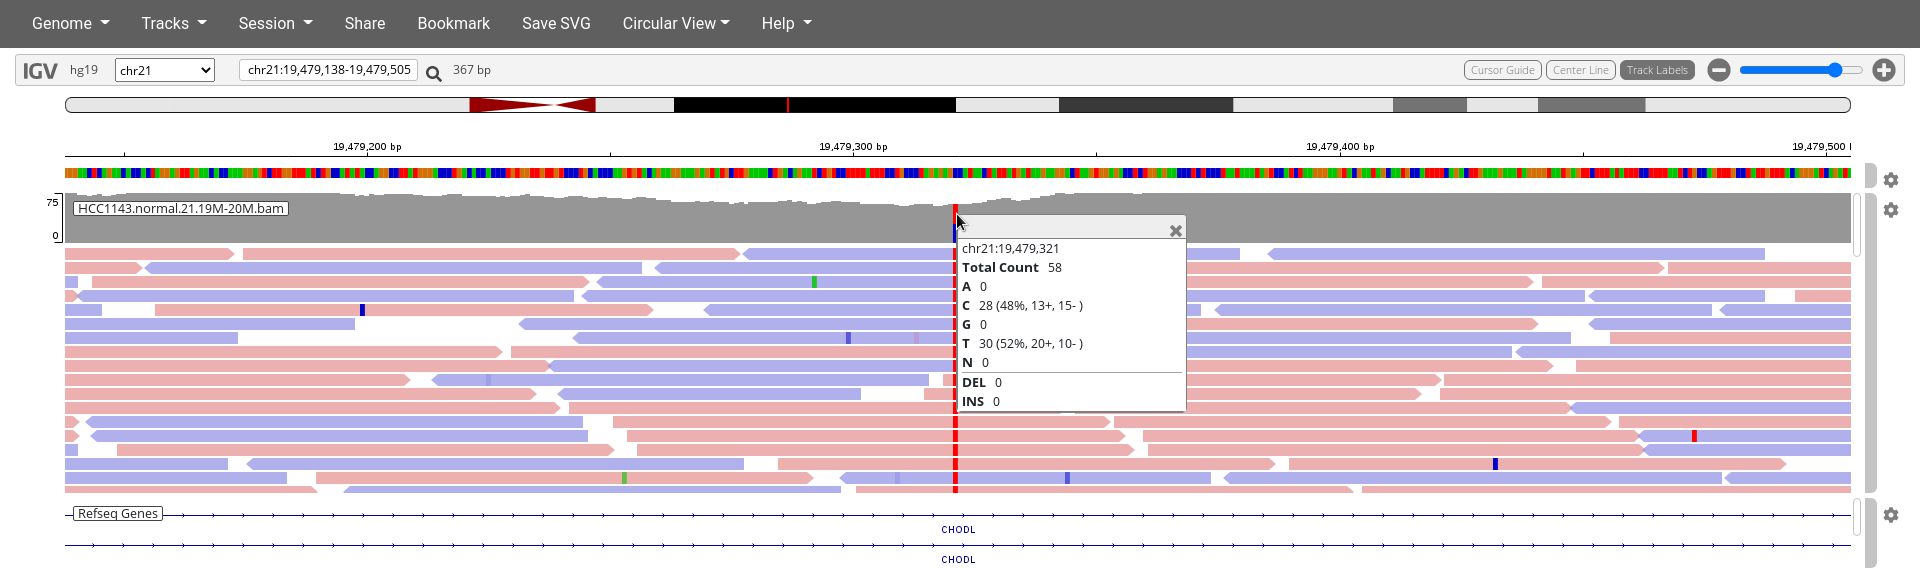
Note
- High base qualities in all reads except one (where the alt allele is the last base of the read)
- Good mapping quality of reads, no strand bias, allele frequency consistent with heterozygous mutation
4. How does Color by read strand help determine if this is a real variant?
5. Also investigate another nearby SNP at
chr21:19,479,731 and determine the frequencies of
A,C,G,T at that location.
Inferred Insert Size
Navigate to position chr21:19,611,925-19,631,555. Note
that the range contains areas where coverage drops to zero in a few
places.
Click on the cog wheel on the right of the
HCC1143.normal.21.19M-20M.bamtrack and click onDisplay mode:squishAlso click
Color by:pair orientation & insert size (TLEN)
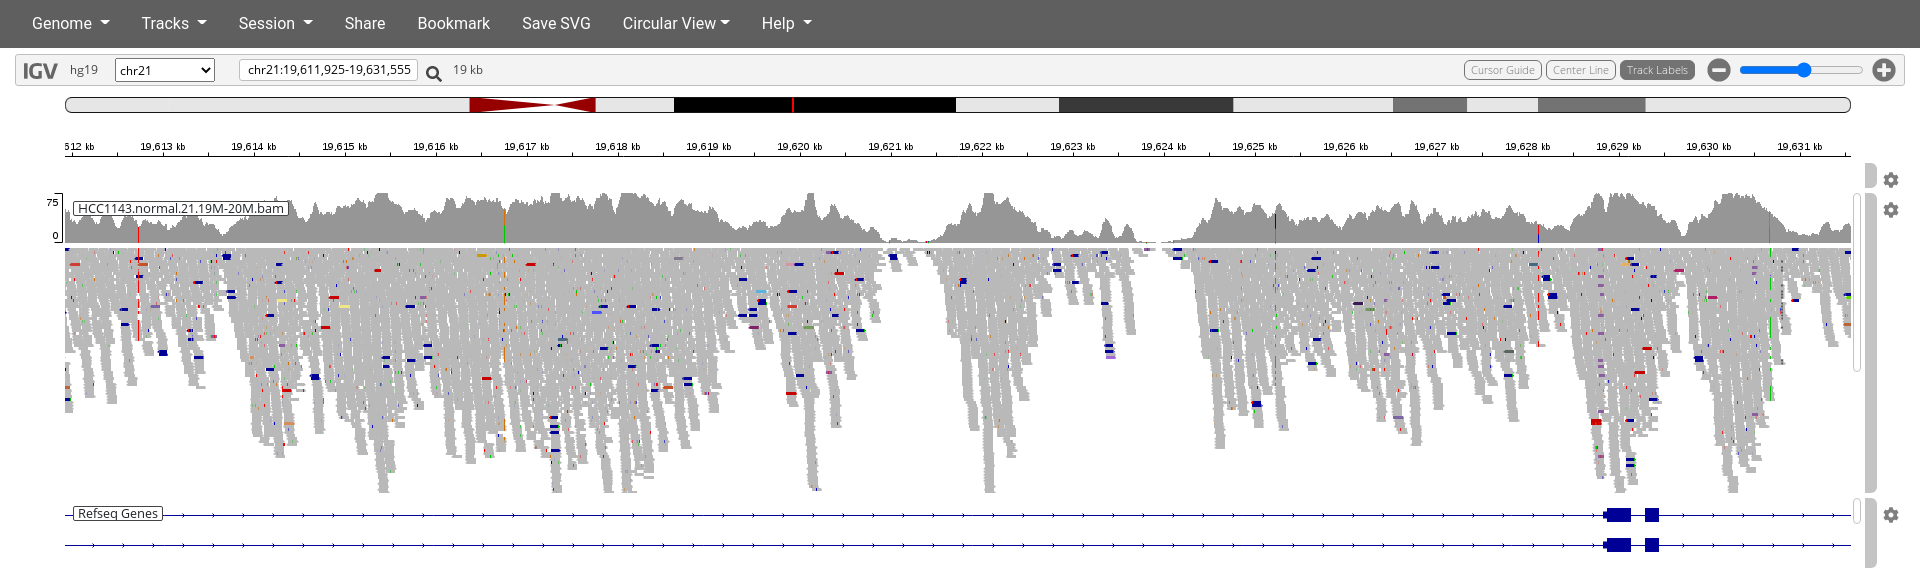
6. Why are some reads throughout the alignments highlighted deep blue or red?
Heterozygous SNPs on different alleles
Navigate to region chr21:19,666,833-19,667,007
Click on the cog wheel on the right of the
HCC1143.normal.21.19M-20M.bamtrack and click onDisplay mode:expandSort by base (at position
chr21:19,666,901)
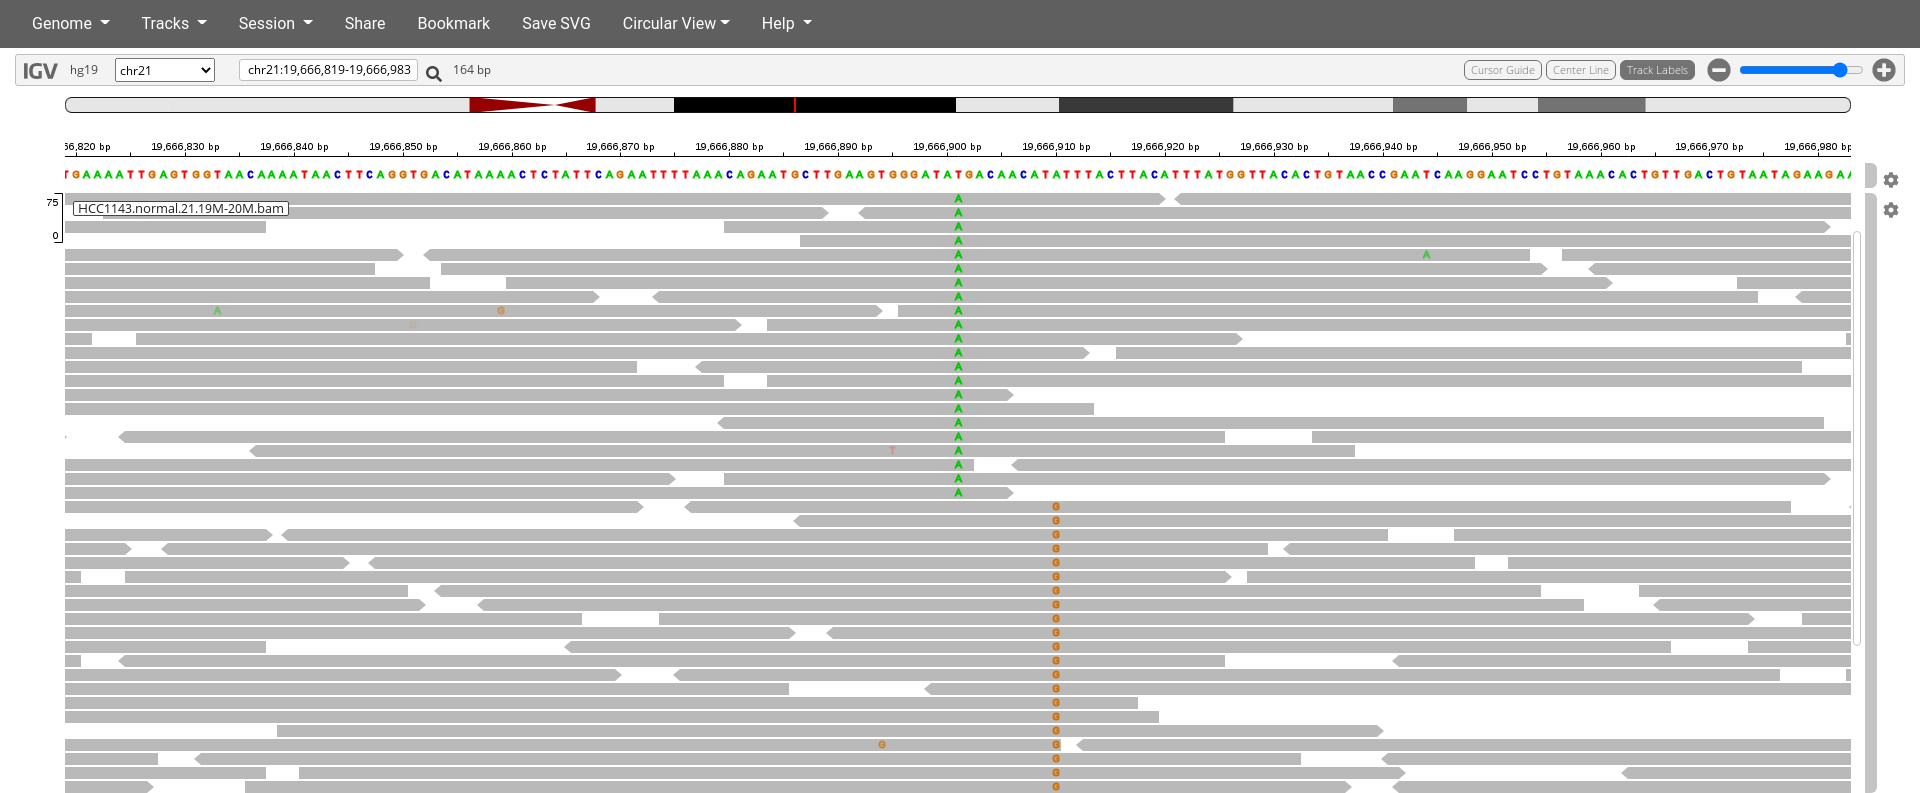
7. Are the two (non-reference) single-nucleotide variants linked together (existing on the same haplotype) or not at all? How can you tell?
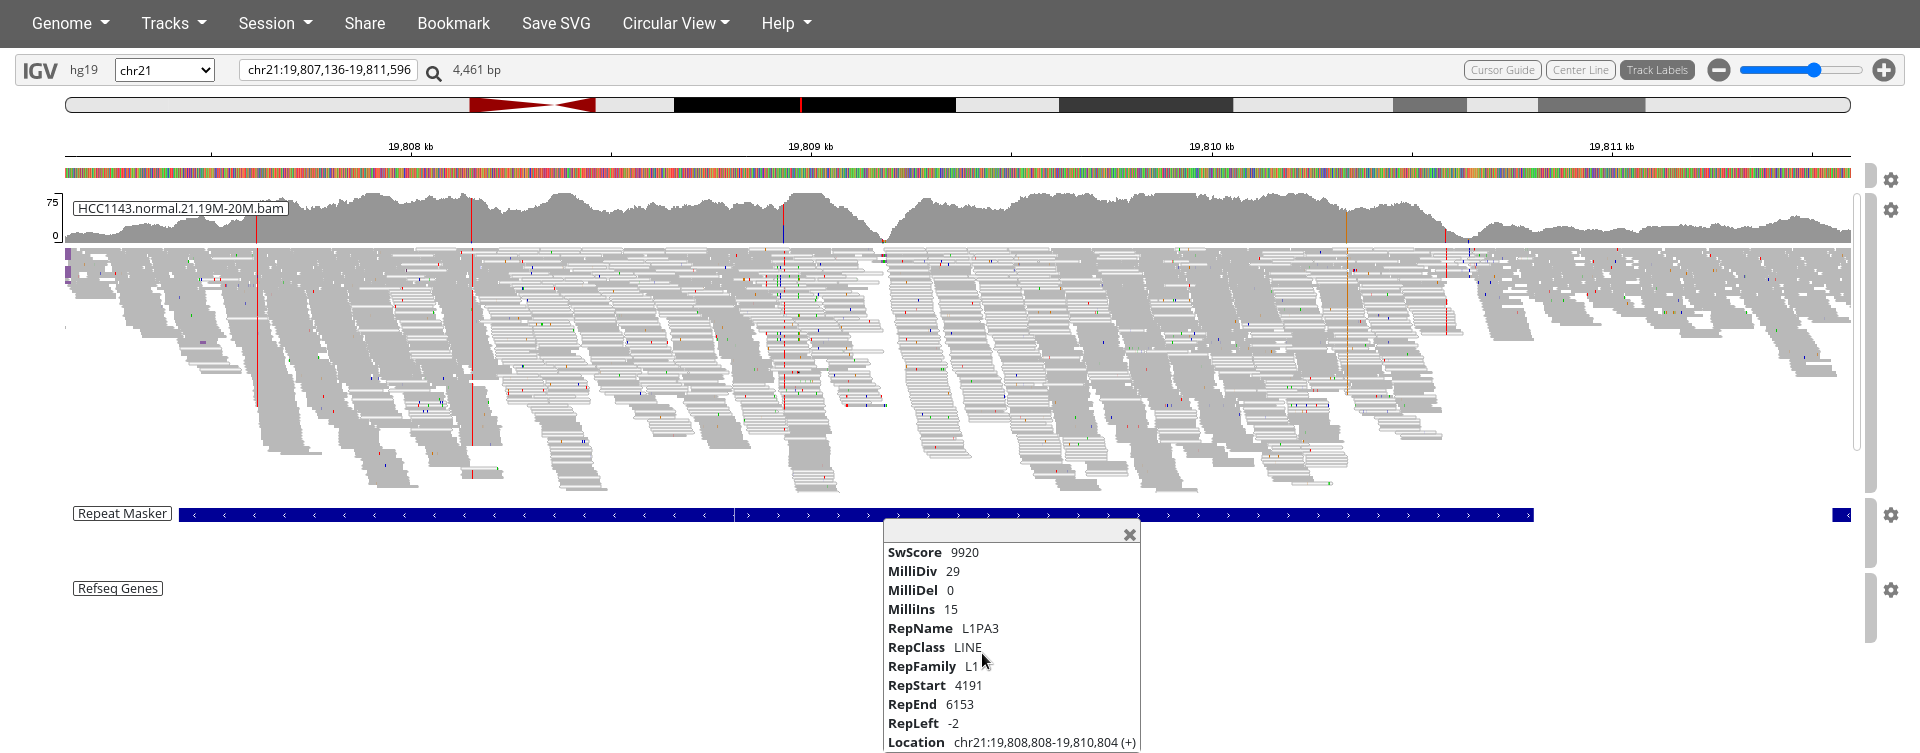
Low mapping quality
Navigate to region chr21:19,800,320-19,818,162
- Load the repeat track (
Tracks>Annotations> selectRepeat Masker>OK)
8. Why are so many reads highlighted in white (instead of gray)?
9. Can you explain the poor mapping quality in these regions, when you look at the features indicated on the Repeat Masker track?
Homozygous deletion
Navigate to region chr21:19,324,469-19,331,468
- Click the cog wheel on the right of the
HCC1143.normal.21.19M-20M.bamtrack and clickView as PairsandDisplay mode:expand - Use
Color bypair orientation & insert size (TLEN) - Right click on the
HCC1143.normal.21.19M-20M.bamtrack and clickSort by...insert size. - Click on a read pair to pull up information.
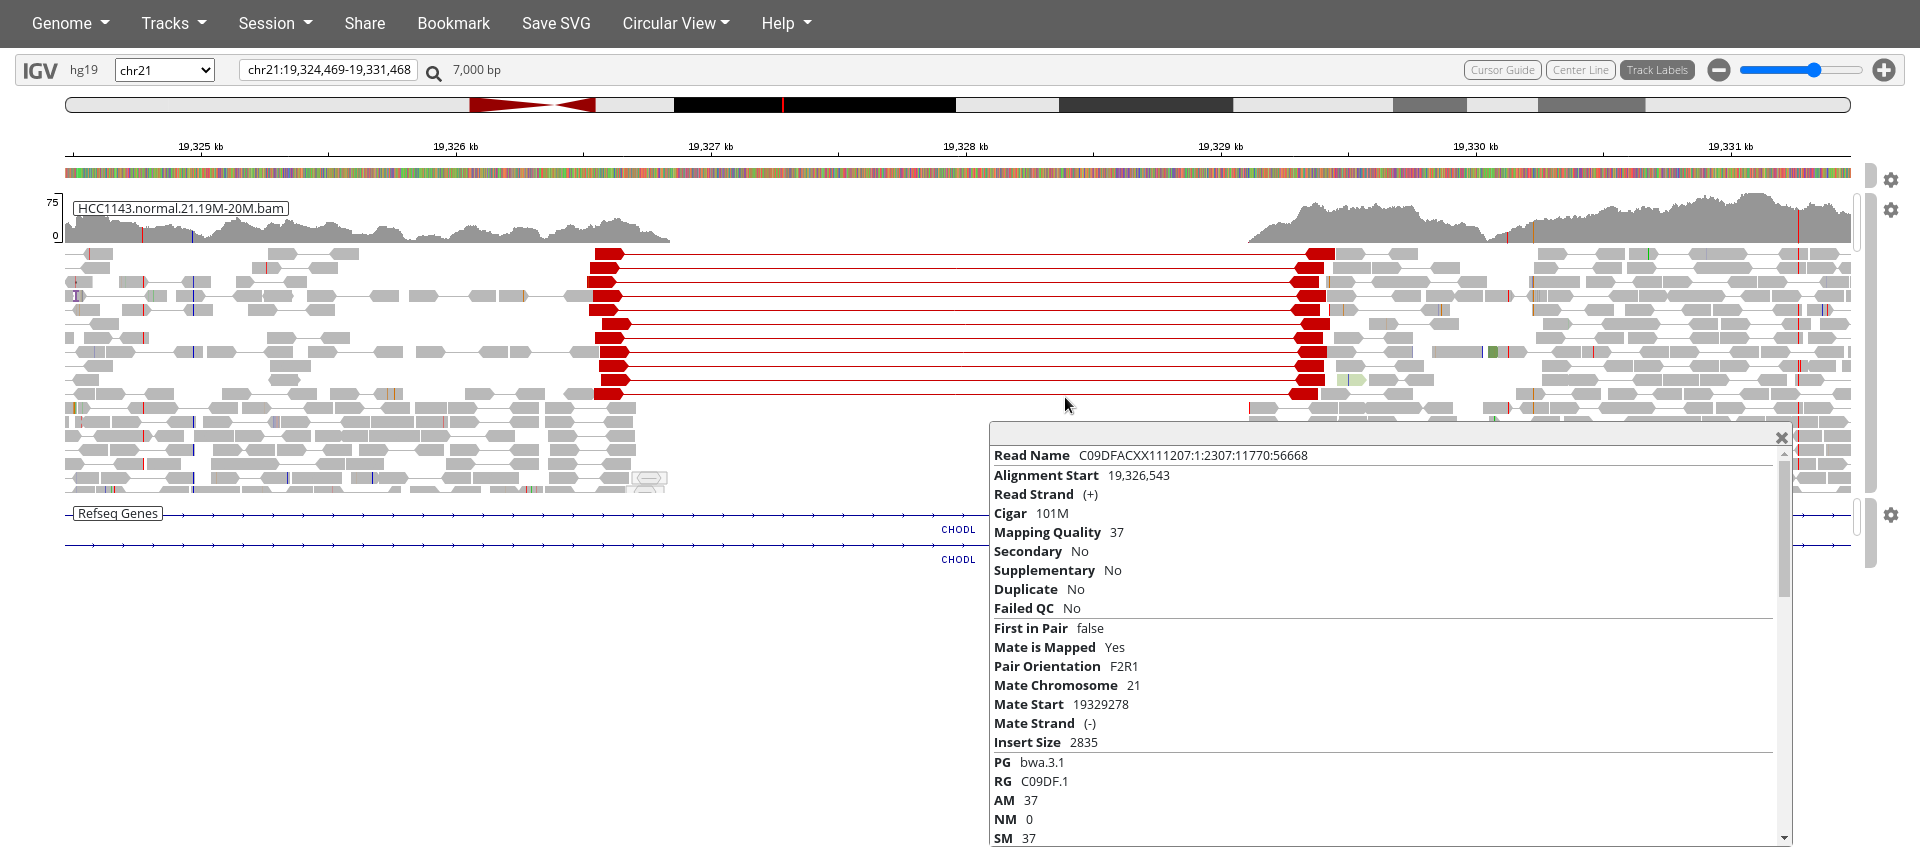
10. What is the insert size of these read pairs indicated in red?
11. What is the typical insert size if you look at the surrounding read pairs?
12. How large is the deletion?
13. Why does this section indicate a homozygous deletion in the subject genome and not a heterozygous deletion?
Mis-alignment
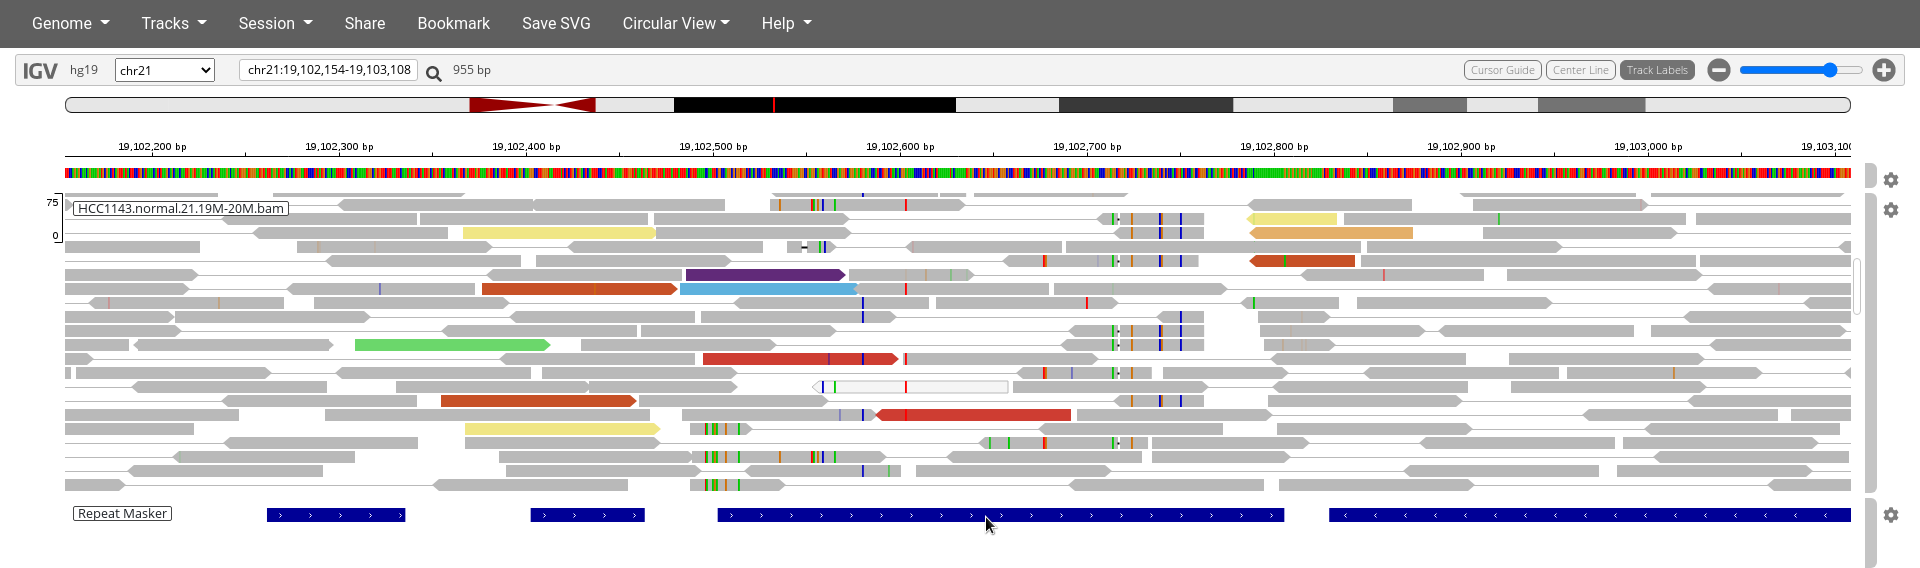
Navigate to region chr21:19,102,154-19,103,108
- Make sure you use
Color bypair orientation & insert size (TLEN)and note the reads highlighted in diverse colors.
14. What do the diverse color highlights indicate?
15. Where can you find a legend of these colors?
- Make sure you have the Repeat Masker track enabled.
16. Can you find out which feature on the Repeat Masker could be causing the mapping issues in this region?
17. Explain in your own words how this element causes these mapping issues.
Translocation
Navigate to region chr21:19,089,694-19,095,362.
- Click
Color bypair orientationand try to find the three read pairs highlighted in green.
![]()
18. What is unusual about these three read pairs indicated in green?
19. How can you explain that pattern?
Note
- There are many reads with mismatches to reference in this region.
- Some read pairs in RL pattern (instead of LR pattern)
- This region is flanked by reads with poor mapping quality (white instead of grey)
- There are also some reads with pairs mapped to other chromosomes.
Extra to think about (completely optional)
Adv1. What software was used to map these reads?
Adv2. What would actually happen if you load the data, but use the wrong reference genome, say Human (hg18)?
Adv3. A SAM file reports the reference sequence name in the header, but does not explicitly contain the reference sequence. Could we reconstruct the reference sequence from just the alignments in the SAM file?
*Adapted from Genomic Visualization and Interpretations - Griffith Lab